Creating Graphs from Connectivity
The graphing option for multi-ROIs provides an opportunity to investigate the inter-relationship between connected components.
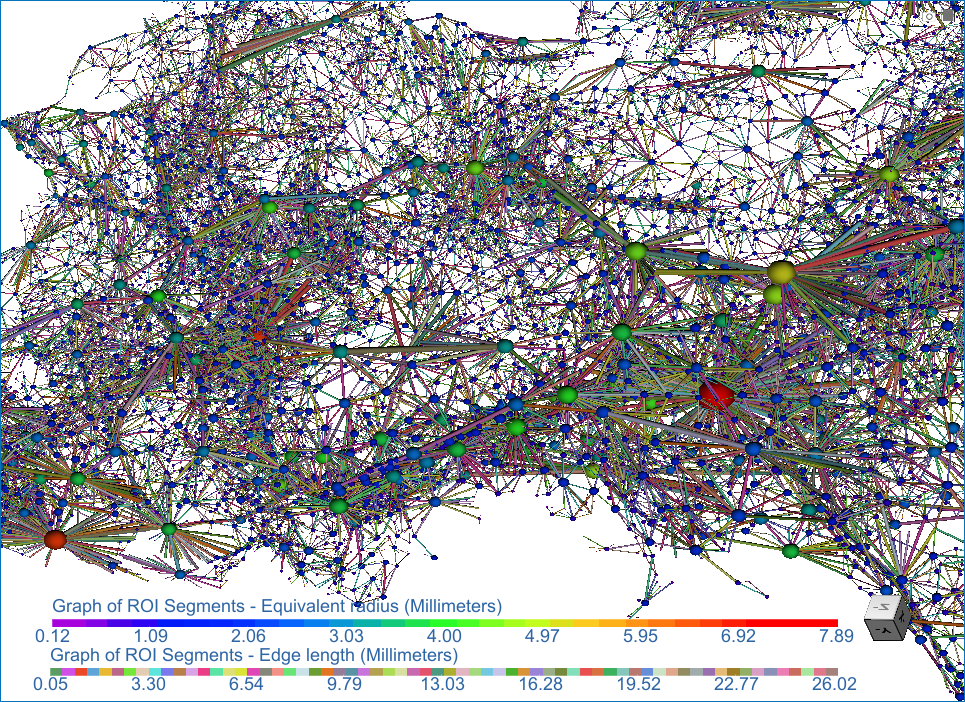
Graphs of multi-ROIs, in which the centroid of adjacent objects are linked, can be examined in 3D views as shown below. Graph settings, as well as information about the graphed objects, are available on the Data Properties and Settings panel and in the Measurement Inspector.
Graph of connectivity
Graphs of connectivity cannot be created if none of the components in the multi-ROI are connected. In such cases, you could consider performing a Watershed to ensure that components are connected (see Watersheds).
The following measurements are available for graphs of connectivity.
| Item | Description |
|---|---|
| Edge | Edge length… Is the Euclidean length of the line segment that connects vertices. |
| Vertex | Equivalent radius… Is the equivalent radius of the vertices. |
 How to Create a Graph from Connectivity
- Create the required multi-ROI.
- Right-click the multi-ROI in the Data Properties and Settings panel and then choose Create Graph from Connectivity in the pop-up menu.
When skeletonization, labeling, and all other computations are complete, the graph appears in the Data Properties and Settings panel.
- Show the graph in the 3D view of the current scene.
- Adjust the graph settings, as required, in the Graph settings box.
- You can adjust the radius of spheres representing the centroid of each connected component, as well as their connectors.
- You can apply different LUTs to ports.
- You can also adjust measurement ranges by filtering minimum and maximum values in the Measurement Inspector (see Evaluating Graphs with the Measurement Inspector).
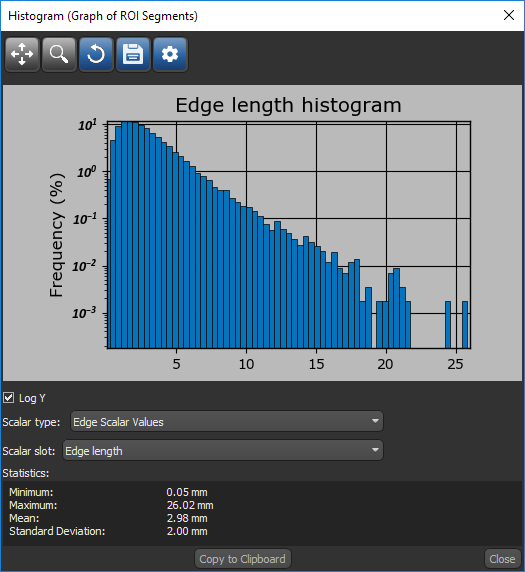
- Plot histograms of selected measurements, as shown below.
Note You can export histogram data in the comma-separated values (*.csv extension) file format.